How to use
1. Open the Diabetes Report and set your 'Highest Target' and 'Lowest Target' range.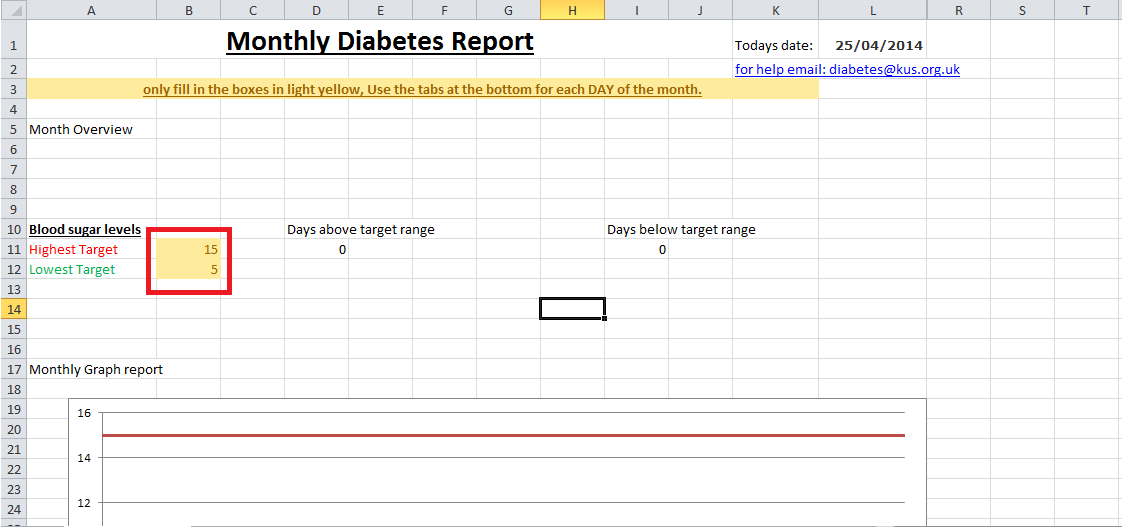
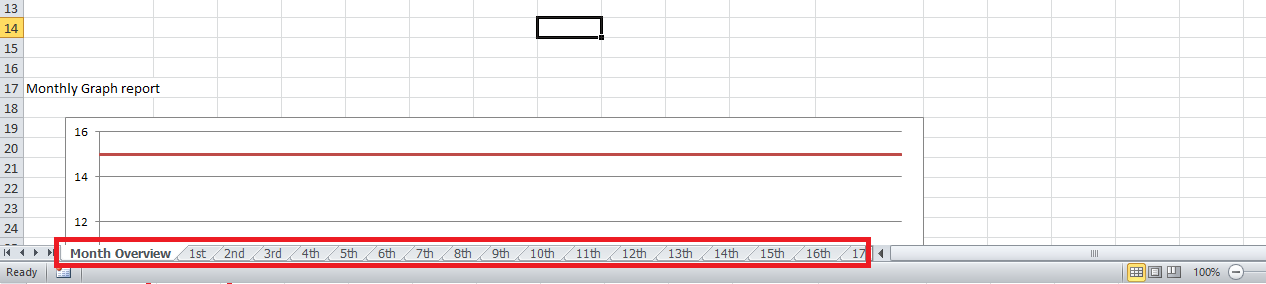
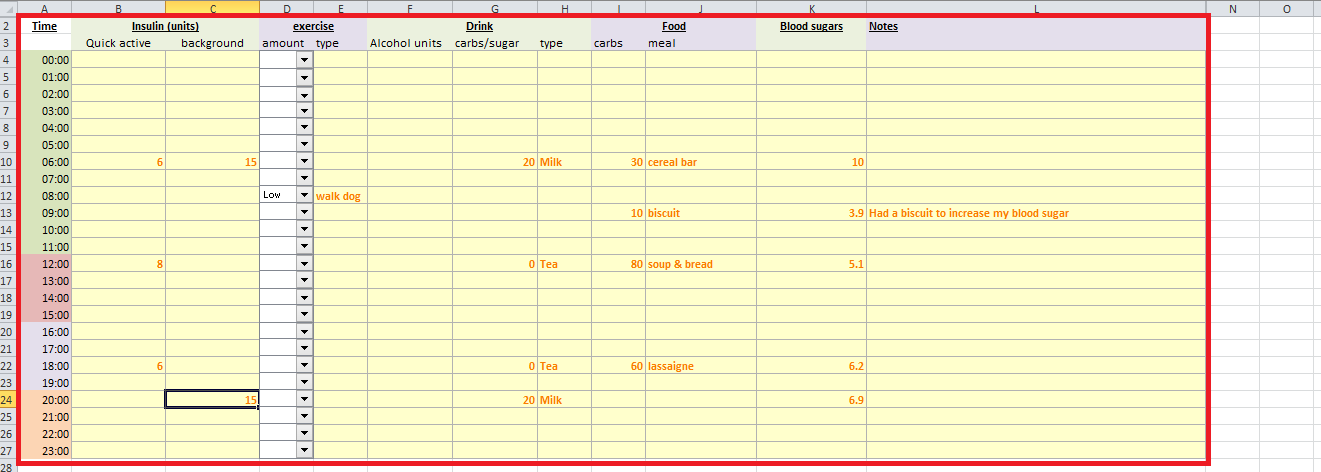
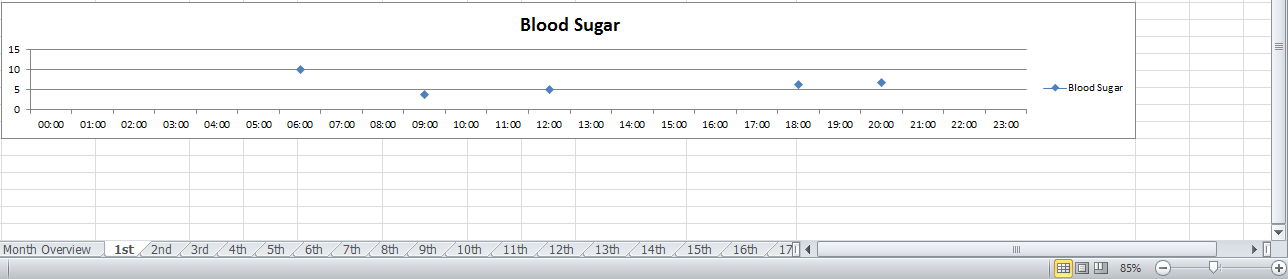
2. The tabs at the bottom represent each day of the month. Click on the current day and fill out the information.
3. Fill out as much information as you can for the day.
4.After each day a graph will be produced at the bottom of the sheet.
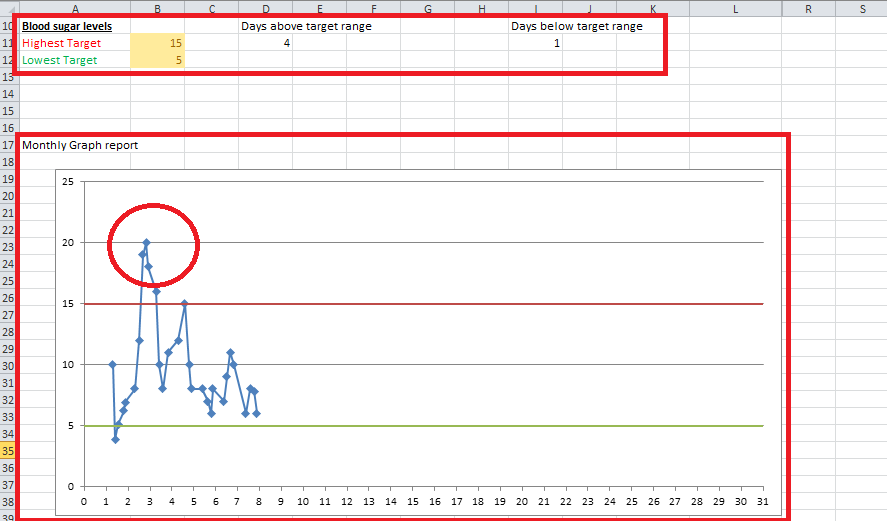
5. On the 'Month Overview' tab information regarding target range and a graph is produced.
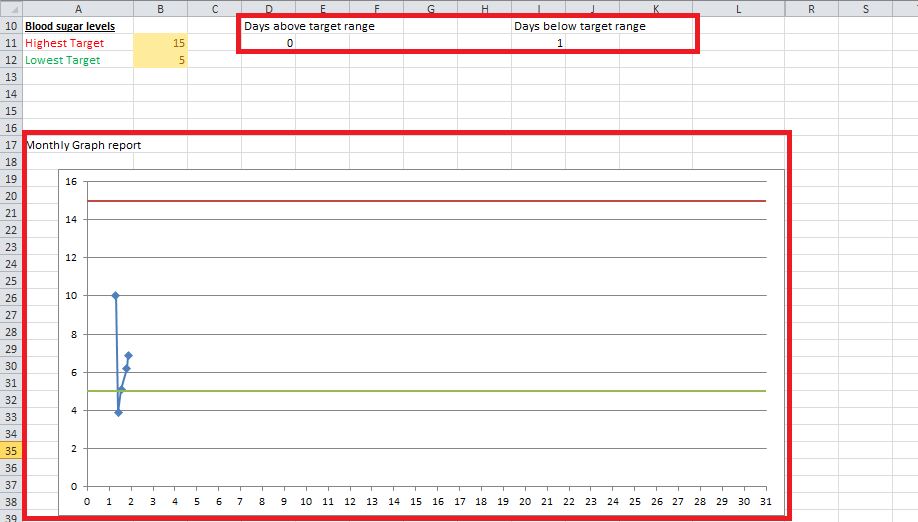
6. Using the graph you can identify sugar reading that are out of the range and by selecting the dates from the tabs at the bottom you can investigate why the sugar reading are out of your target range.